|
|
 |

Eiji Ogawa (Graduate School of Commerce and Management, Hitotsubashi Univ.)
Junko Shimizu (Institute of Economic Research (COE), Hitotsubashi Univ.)
We calculate and publish the data of AMU(Asian Monetary Unit) and AMU Deviation Indicators on HP of both Hitotsubashi University and RIETI(Research Institute of Economy, Trade and Industry) as the joint project of 21st century COE project of Hitotsubashi University (Project leader: Prof. Osamu Saito) and RIETI. In the following section, we explain about AMU and AMU deviation Indicators.
The Purpose of the Asian Monetary Unit (AMU)
and AMU Deviation Indicators for East Asian Currencies
The monetary authorities of East Asian countries have been strengthening their regional monetary cooperation since the Asian currency crisis of 1997. This monetary cooperation after the crisis resulted in the Chiang Mai Initiative (CMI), which was launched by the ASEAN + 3 (Japan, Korea, and China) as a network of bilateral and multilateral swap arrangements to deal with a currency crisis in member countries.
The CMI calls on the region's monetary authorities to monitor exchange rate movements and in our study we propose a possible way in which an Asian Monetary Unit could be constructed and develop AMU Deviation Indicators. These should help to coordinate exchange rate policies in East Asia, thereby enhancing the monetary authorities' surveillance capabilities. We calculate the AMU as a weighted average of East Asian currencies following the method used to calculate the European Currency Unit (ECU) adopted by EU countries under the European Monetary System (EMS) prior to the introduction of the euro. The AMU Deviation Indicator for each East Asian currency is calculated to show the degree of deviation from the hypothetical benchmark rate for each of the East Asian currencies in terms of the AMU.
We provide two indicators: a Nominal AMU Deviation Indicator on a daily basis; and a Real AMU Deviation Indicator on a monthly basis, which is adjusted for differences in inflation. The Real AMU Deviation Indicator is more appropriate for monitoring the effects of changes in exchange rates on the real economy, while the Nominal AMU Deviation Indicator is more useful for monitoring their day-to-day deviations from the AMU.
Calculating the value of the AMU
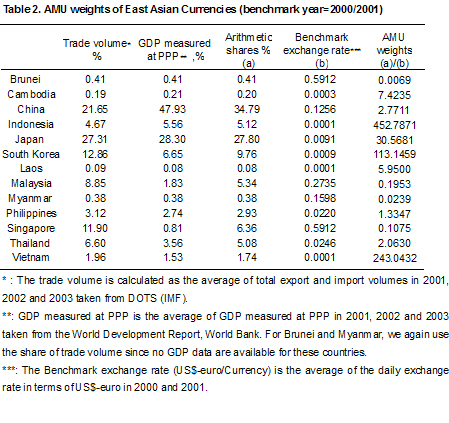
We calculate the AMU as a basket consisting of the currencies of the ASEAN10+3 (Brunei, Cambodia, Indonesia, Laos, Malaysia, Myanmar, the Philippines, Singapore, Thailand, Vietnam, Japan, South Korea, and China). The weight of each currency in the basket is based on countries' respective share in regional GDP measured at PPP and their trade volume share (the sum of exports and imports) in 2001-2003 in order to reflect the most recent trade relationships and economic conditions of the 13 East Asian countries for calculation of the AMU. We quote the value of the AMU in terms of a trade weighted average of the US dollar and the euro (US$-euro) because both the United States and the EU countries are important trading partners for East Asia. We use a weight of 65% for the US dollar and of 35% for the euro. (*1)
Next, we choose a benchmark period in order to calculate AMU Deviation Indicators based on the following criterion: the total trade balance of member countries, the total trade balance of member countries (excluding Japan) with Japan, and the total trade balance of member countries with the rest of world should be close to zero.
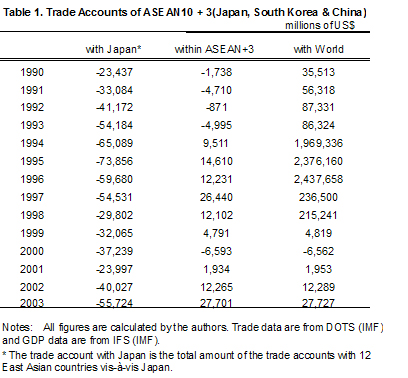
Table 1, which shows the trade accounts of the 13 East Asian countries from 1990 to 2003, indicates that the trade accounts were closest to balance in 2001. Assuming a one-year time lag before changes in exchange rates affect trade volumes, we should choose 2000 and 2001 as the benchmark period. For the benchmark period, the exchange rate of the AMU in terms of the US$-euro is set at unity. We define the exchange rate of each East Asian currency in terms of the AMU during the benchmark period as the Benchmark Exchange Rate.
In summary, the AMU weights are calculated based on both the arithmetic shares of trade volumes and GDP measured at PPP for 2001-2003. The Benchmark Exchange Rate for each currency is defined in terms of the AMU during 2000-2001. Table 2 shows the AMU weights as well as trade volumes, GDP measured at PPP, arithmetic shares, and the Benchmark Exchange Rates.
We define the nominal exchange rate of the AMU in terms of the US$-euro as the weighted sum of each country's US$-euro exchange rate using the AMU weights in Table 2. We can use the AMU weights in Table 2 to calculate an exchange rate for the AMU in terms of the US$-euro as follows: (*2)
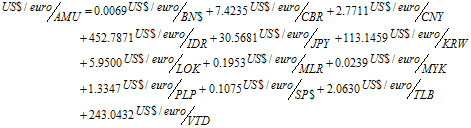
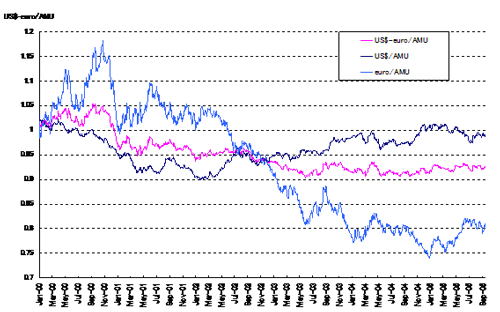
Figure 1 shows the daily movements in the nominal exchange rate of the AMU in terms of the US$-euro. For reference, we add the daily movements of the nominal exchange rates of the AMU in terms of both the US dollar and the euro.
Figure 1. AMU in terms of the US$-euro (benchmark year=2000/2001)
Calculating Nominal and Real AMU Deviation Indicators
We use the nominal exchange rate of each East Asian currency in terms of the AMU to calculate a Nominal AMU Deviation Indicator (%). It indicates how far each East Asian currency i deviates from the Benchmark Exchange Rate in terms of the AMU, which is a weighted average of East Asian currencies. The Nominal AMU Deviation Indicator is calculated as follows:
Nominal Deviation Indicatori
= (Actual exchange rate of AMU/currencyi − Benchmark Exchange Rate of AMU/currencyi)
/(Benchmark Exchange Rate of AMU/currencyi)×100(1)
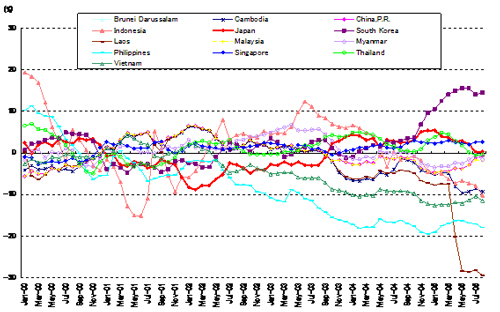
Figures 2 and 3 show the movements in the Nominal AMU Deviation Indicators on a daily and monthly basis, respectively.
Figure 2. Nominal AMU Deviation Indicators (benchmark year=2000/2001, daily)
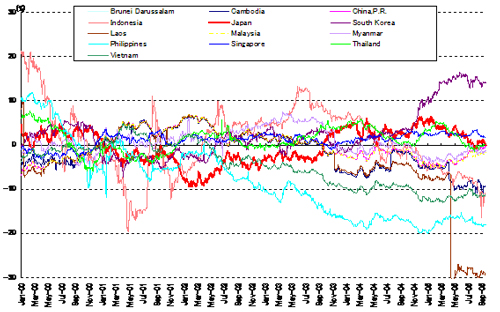
Figure 3. Nominal AMU Deviation Indicators (benchmark year=2000/2001, monthly)
Next, we calculate an AMU Deviation Indicator in real terms by taking into account inflation rate differentials. Given that the Nominal AMU Deviation Indicator is defined as in equation (1), we calculate the Real AMU Deviation Indicator as follows:
Rate of change in real AMU Deviation Indicatori
= (Rate of change in nominal AMU Deviation Indicatori − (PAMU - Pi )(2)
where PAMU is the inflation rate in the AMU area and Pi is the inflation rate in country i.
We use the Consumer Price Index (CPI) to calculate the Real AMU Deviation Index, which can therefore only be computed on a monthly basis with a 5 to 6 month time lag due to data constraints. As for the inflation rate in the AMU area, we calculate a weighted average of the CPI for the AMU area using the AMU shares. Figure 4 shows the movement in the Real AMU Deviation Indicator on a monthly basis for each of the East Asian currencies.
Figure 4. Real AMU Deviation Indicators (benchmark year=2000/2001, monthly)

The Real AMU Deviation Indicator is more appropriate when considering the effects of exchanges on real economic variables such as trade volumes and real GDP. On the other hand, the Nominal AMU Deviation Indicator is more useful when it is important to monitor exchange rate movements on a timely basis. Accordingly, the Nominal and Real AMU Deviation Indicators should be regarded as complementary measures for the surveillance of exchange rate policy and related macroeconomic variables and, in turn, for devising coordinated exchange rate policies among the East Asian countries.
Revision of the benchmark period and the AMU weights
The AMU and AMU Deviation Indicators are the joint project of the 21st century COE project of Hitotsubashi University (project leader: Prof. Osamu Saito) and RIETI (Research Institute of Economy, Trade and Industry). They are updated and uploaded on the HP of RIETI (http://www.rieti.go.jp/users/amu/index.html)on a weekly basis.
Furthermore, we revise the benchmark annually once all the trade account data for the ASEAN10+3 countries are updated. Likewise, AMU weights are revised annually after all of the data on trade volumes and GDP measured at PPP are updated. We hope that they will be widely used not only as surveillance criteria but also in future research.
(*1) We calculate the average trade volumes for 2001-2003.
(*2) BN$=Brunei dollar, CBR=Cambodia riel, CNY=Chinese yuan, IDR=Indonesian rupiah, JPY=Japanese yen, KRW=Korean won, LOK=Laos kip, MLR=Malaysian ringgit, MYK=Myanmar kyat, PLP=Philippine peso, SP$=Singapore dollar, TLB=Thailand baht, VTD=Vietnamese dong.
(*3) CPI data are used as the price index because in some of the countries no other price data are available. There is also a 5 to 6 month time lag until CPI data for all countries are available.
|
 |
| Copyright (C) 2003 by Institute of Economic
Research.All rights reserved. |
|